
Pie in the sky!
The lunacy of the "spAIce bubble". Is a crash landing inevitable for US stocks?


“The less prudence with which others conduct their affairs, the greater the prudence with which we should conduct our own affairs.”
Warren Buffett, Chairman of Berkshire Hathaway and legendary investor.
“Why, sometimes I’ve believed as many as six impossible things before breakfast.”
The Queen in “Through the Looking-Glass”, written by Lewis Carroll, published in 1871.
“In space, no one can hear you scream.”
Tagline from the movie “Alien”, released in 1979.
AI data centers in space!
Rockets whizzing people between continents!
The mining of asteroids!
Trips to Mars!
With the imminent new listing (Initial Public Offering, or IPO) of Elon Musk’s SpaceX stock about to hit US stock markets, these are the sorts of outlandish things that investors are supposed to believe.
It’s all pie in the sky stuff. It’s through the looking-glass. It’s peak speculative exuberance. It’s La-La land. It’s giga hype.
For the avoidance of doubt, I’m not saying that none of these things will happen, one day. But they’re all extremely technologically complex, capital-intensive, and running on indeterminate timelines that will probably stretch way past current blue-sky promises. And aside from money and engineering, the laws of physics will be the arbiters of success.
(Mining asteroids and transporting bulk ore back to Earth? Really?)
They don’t make a good basis for investors to pay something of the order of 100 times SALES (i.e. top-line revenues before costs) to buy SpaceX stock, which is the current expectation.
For the stock of a fairly new, very high-growth, capital-light technology company with huge operating leverage - such as a software business - paying a price-to-sales (P/S) ratio of 10x might turn out to be reasonable, or even a bit above that.
The promise is that a fountain of free cash flow will erupt within a few years, as surging sales overtake slower-growing costs, and continue to grow at pace for many more years beyond.
In other words, without all that inconvenience of constantly having to sink billions of dollars of cash capital expenditure into depreciating fixed assets, or having to hire more and more expensive people to build it all.
But 100 times sales for a manufacturer-cum-glorified transport company? Nuts.
To put things into perspective, let’s say that the P/S ratio falls to 10x after a decade (which would still be high). That would mean the top-line sales revenue would have to go up by 10 times just to keep the stock price flat for investors.
Growth of ten times over ten years requires a compound annual growth rate that’s just shy of 26% a year. And, in this example, that’s just so that investors reach break-even in nominal terms. (They’d still be down in real terms.)
Want to make 10% a year actual profit on the investment? Those sales need to grow at a compound 39% a year (110% x 126% = 139%, rounded).
But is 10% a year enough to compensate for the high risk of such a speculative stock? Definitely not, in my book at least.
At 15% a year required investor return, sales would have to grow at a compound rate of 45% a year. That would mean multiplying sales by a factor of 41 over a decade.
If 20% annually is required? You’d need sales growth - year-in, year-out - of 51% a year. That’s a multiple of 62 over ten years, with compounding.
Can any industrial business really build itself that fast? The short answer is... almost certainly not.
And even if it could, can it really fund it using just its own cash generation supplemented with borrowing? Or would it need to raise a vast amount of new equity capital along the way, thus diluting the pre-existing shareholders?
The sums just don’t add up.
This may explain why part of the initial share sale is being made available to retail investors. In recent years, a lot of the professional finance types that manage investment funds do seem to have lost sight of basic valuation principles. But perhaps the SpaceX stock pricing is too far into the stratosphere even for them.
(Although congratulations are in order for those that managed to get a piece of the unlisted equity at an early stage.)
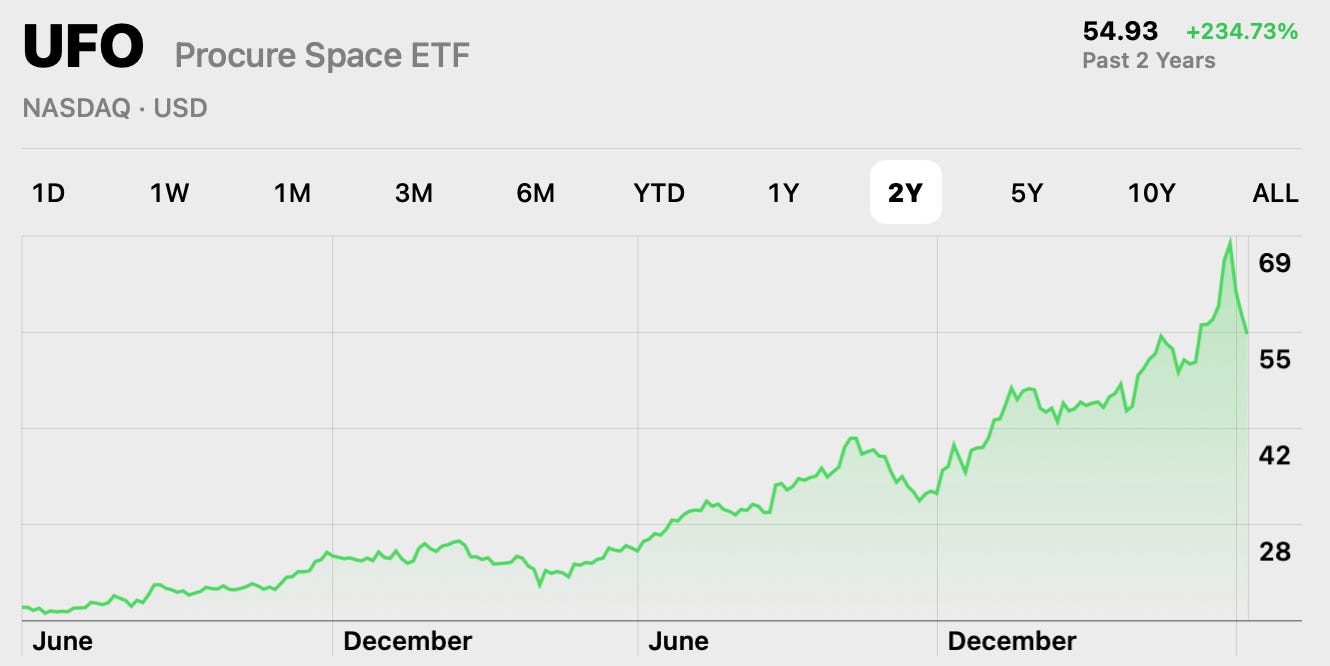
Over the past couple of years, as anticipation has built ahead of the SpaceX IPO, you could have bought stock of practically any old company with a link to the space industry and ended up with a huge gain. No matter if they make a profit, or if that happy event is on the imminent horizon.
To illustrate, here’s a chart of the Procure Space ETF (NASDAQ:UFO), showing a gain of 235% over just two years:
Source: Stocks (an app)
Incidentally, note the sharp drop from the peak price reached on 28 May, which amounts to -19%. I’ll come back to that.
What’s more, SpaceX isn’t alone. Its IPO is expected to be followed by trillion dollar listings of two AI pioneers, Anthropic and OpenAI, purveyors of the Claude and ChatGPT AI tools respectively. Themselves running up huge and growing losses as (per reports) cost growth (compute etc.) continues to outrun sales growth.
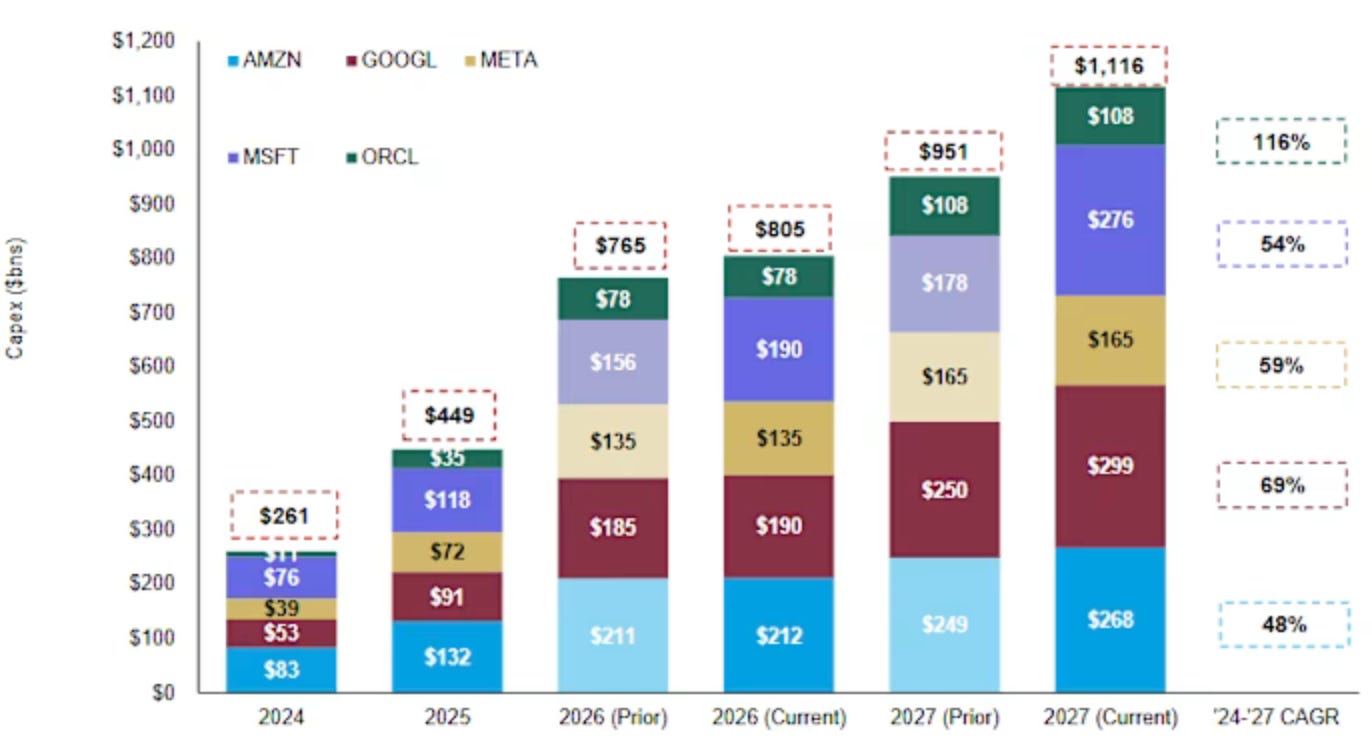
Back on Earth, the AI “hyperscalers” are shovelling hundreds of billions of dollars into capital expenditure (capex) to build data centers.
Below is a chart showing how the combined capex of Amazon (AMZN, Alphabet (GOOGL), Meta Platforms (META), Microsoft (MSFT), and Oracle (ORCL) has exploded in recent years, and is expected to keep climbing rapidly.
Source: Sorry, I mislaid it.
From $261 billion capex spend in 2024 it’s expected to reach $805 billion this year, based on announced plans from the companies. That’s an increase of more than three times in two years, with further large increases planned.
The result is trillions of dollars of depreciating fixed assets. Data center shell buildings, semiconductor chips, assorted peripheral infrastructure (power, cooling systems, security, and so on).
That requires ongoing maintenance capex spend. Some of it becomes obsolete within a few years (e.g. older generation semiconductors), and has to be replaced. This means these companies aren’t just committing to the current build. They are also committing to vast ongoing capex costs just to keep it all going.
Who uses all this compute capacity? Partly the hyperscalers themselves, and partly the Anthropics and OpenAIs of the world. Those loss-making, cash-burning outside customers rely on the trust, hopes and prayers of venture capitalist (VC) funding to keep them afloat. Or cash injections from the hyperscalers themselves.
“We invest in you, you buy our services with the cash.” In other words, circular financing that creates a mirage of growth on both sides of the fence.
Even worse, those ownership stakes in the AI boom get revalued at “mark-to-myth” valuations, based on whatever was coaxed out of VCs at the last funding round.
That leads to gains being reported in quarterly income statements. Which leads to inflated profits but of a very poor quality. A marked-up value placed on an unlisted investment, and the associated unrealised gain, is nowhere near the same quality class as tidal waves of actual cash flooding through a company’s doors.
For an example, the first quarter pre-tax profit of Alphabet (the Google people) came to $77.4 billion. Of that, $37 billion, or 48%, was from valuation gains on equity stakes.
This reported profit inflation leads to lower price-to-earnings (P/E) ratios than otherwise. This can lead to investor complacency. These companies can appear far cheaper than they may actually be.
(Alphabet’s first-quarter post-tax profit came to $62.6 billion. But free cash flow, after all the heaving capex spending, was a measly $10 billion. Annualised that’s $40 billion. With Alphabet’s market capitalisation at $4.4 trillion, that gives a price-to-free cash flow multiple of 110x. Ouch... at least, based on the last quarter. Whereas the trailing P/E ratio is 28x, which looks reasonable at first glance. Remember, cash flow is king.)
Of course, those equity stakes could actually be sold in future for even higher prices than their current price marks. Perhaps, maybe, possibly, in the fullness of time.
But they could also implode if the current AI mania subsides, and people realise that the investment spend was excessive in relation to the business opportunity, leading to huge asset write-downs.
Nobody knows. But the point is that earnings quality is low, free cash flows are impaired by the vast capex (now and in future), and it’s all riding on assumptions that “If you build it, they will come”.
Which was the same assumption used in past infrastructure manias, such as British canals, US railroads, and fibreoptic internet cables. True, “they” (customers) did eventually come. Just a lot, lot later than the builders thought. And well after severe financial distress.
In any case, those were truly long-lived assets, so they had huge residual value. Whereas an awful lot of what goes into a data center simply isn’t. Computer hardware - all that stuff on the inside - actually has very soft residual value within just a few years, as it becomes obsolete.
The only stocks that make some sense within this AI goldrush are the semiconductor companies that sell the computing power to everyone else, meaning the likes of Nvidia.
But there’s a problem here too. If the business fantasies dreamt up by the hyper-scalers and AI companies turn to dust, then so will their purchases of compute power. Data centers will be mothballed, like so many coal mines, and sales of new chips will drop off a cliff. Then the semis will be decimated too.
Bending the index rules
An important technical detail is that some of the guardians of the US stock indices have decided to change their rules for index inclusion especially, just because of the SpaceX IPO, and in anticipation of Anthropic and OpenAI also coming to market this year.
Most notable is Nasdaq, but also MSCI, FTSE Russell (providers of the Russell family of indices), and Morningstar CRSP.
Nasdaq led the charge, allegedly because they wanted to ensure that SpaceX stock was listed on the Nasdaq exchange, instead of the competing New York Stock Exchange (NYSE).
Since May, there are new “Fast Entry” rules for inclusion in Nasdaq indices of companies with very large market capitalisations, meaning that they would rank within the top 40 index members by market capitalisation.
There are three key rules that they’ve changed:
Fast track inclusion in the Nasdaq indices just 15 days after the stock listing, instead of the previous requirement of a minimum three months (but usually much longer, since index constituents were only reviewed and amended once a year before).
Scrapping the minimum free-float percentage requirement of 10% of the shares, whereas SpaceX is only planning to list around 5% of its shares in the first instance.
The index weight will no longer be linked automatically to the actual free float percentage. In the case of SpaceX, it will get a weighting that is 3x the actual free float. In other words, the index provider will assume that there is a 15% free float.
This has big implications for stock funds that track Nasdaq indices. They’ll have to buy SpaceX stock according to these rules once it’s in the indices, otherwise they won’t be doing their jobs.
This will create accelerated and oversized demand for the stock shortly after the IPO. Chances are that it will drive the price higher in the short run, to even more eyewatering levels.
This whole business has a really bad smell about it. Musk and his co-shareholders get a sweet deal that provides artificial price support. Whereas index investors - ordinary people - will get lumbered with the vastly overpriced stock of a pipedream company.
To their great credit, the powers that be at S&P Dow Jones Indices have just confirmed that they won’t change their index rules. This means that SpaceX stock won’t be shoehorned into the S&P 500 index at the first opportunity.
Instead it will have to comply with the existing rules: a minimum of 12 months post-IPO trading; a minimum free float of at least 10% of the shares; and a “financial viability screen” which requires at least four consecutive quarters of positive net income from continuing operations (i.e. profitable companies only).
Hurrah for this scintilla of sanity.
The bigger backdrop isn’t brilliant
US Gross Domestic Product (GDP) grew by 2% in the year to the end of March 2026. That’s a decent enough result on the face of it. But let’s dig a little deeper.
First of all - and bear with me on this, it’s important - here’s a reminder of the formula used to calculate GDP:
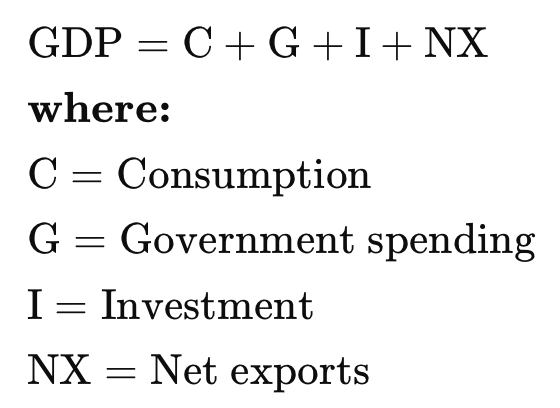
Looking at the individual elements sheds some light on the quality of current GDP growth.
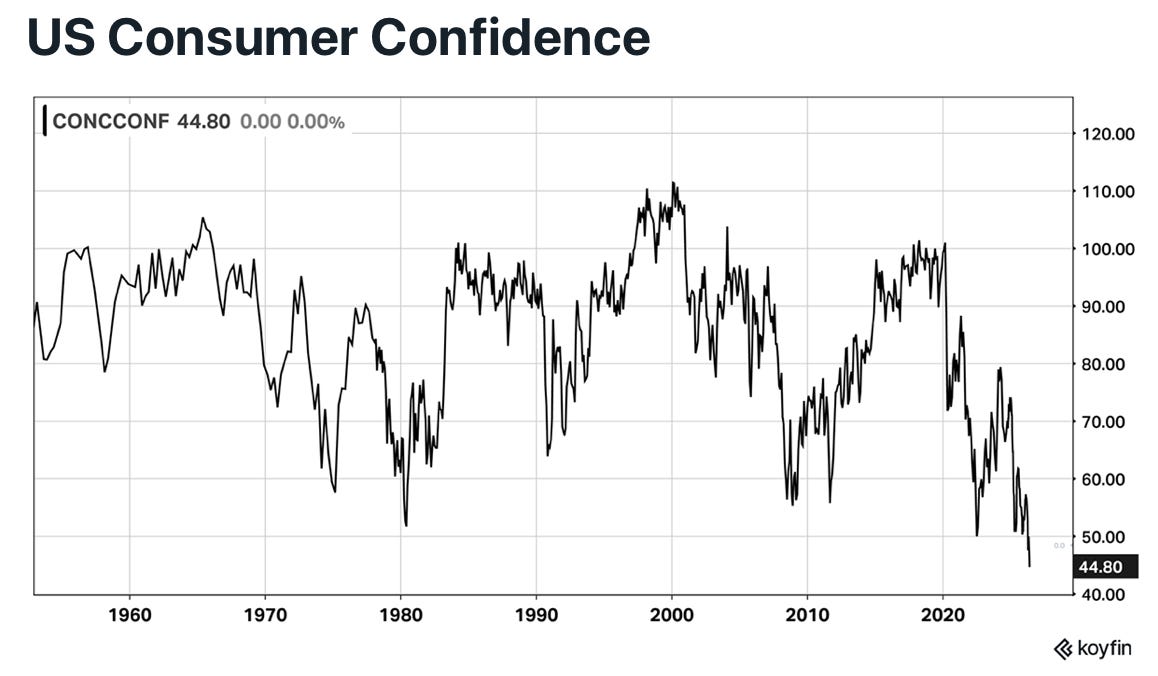
Consumption: US consumer sentiment, as measured by the University of Michigan consumer sentiment survey, is at an extreme record low. It’s fair to assume that this isn’t a good sign in an economy which has consumption as its bedrock.
Government spending: The US federal government is running a fiscal deficit of more than 6% of GDP. That would have made past generations blush with embarrassment, as the debts continue to pile up at a rapid pace. The ambitious cost-cutting promises of the Department of Government Efficiency (DOGE), under the same Mr. Musk’s previous direction, have been consigned to the dustbin of history.
If the economy is supposedly so strong, why does the government have to blow so much cash? Put another way, without this debt-funded government largesse (much of which is unproductive waste), the GDP figure would be far, far weaker.
The huge deficits incurred after the Global Financial Crisis or during the Covid pandemic lockdowns can perhaps be forgiven. But where’s the recovery? Where’s the pay-off in fiscal surpluses? As the following chart shows, there has been a worsening trend for the size of fiscal deficits since around year 2000, or more than a quarter of a century ago.
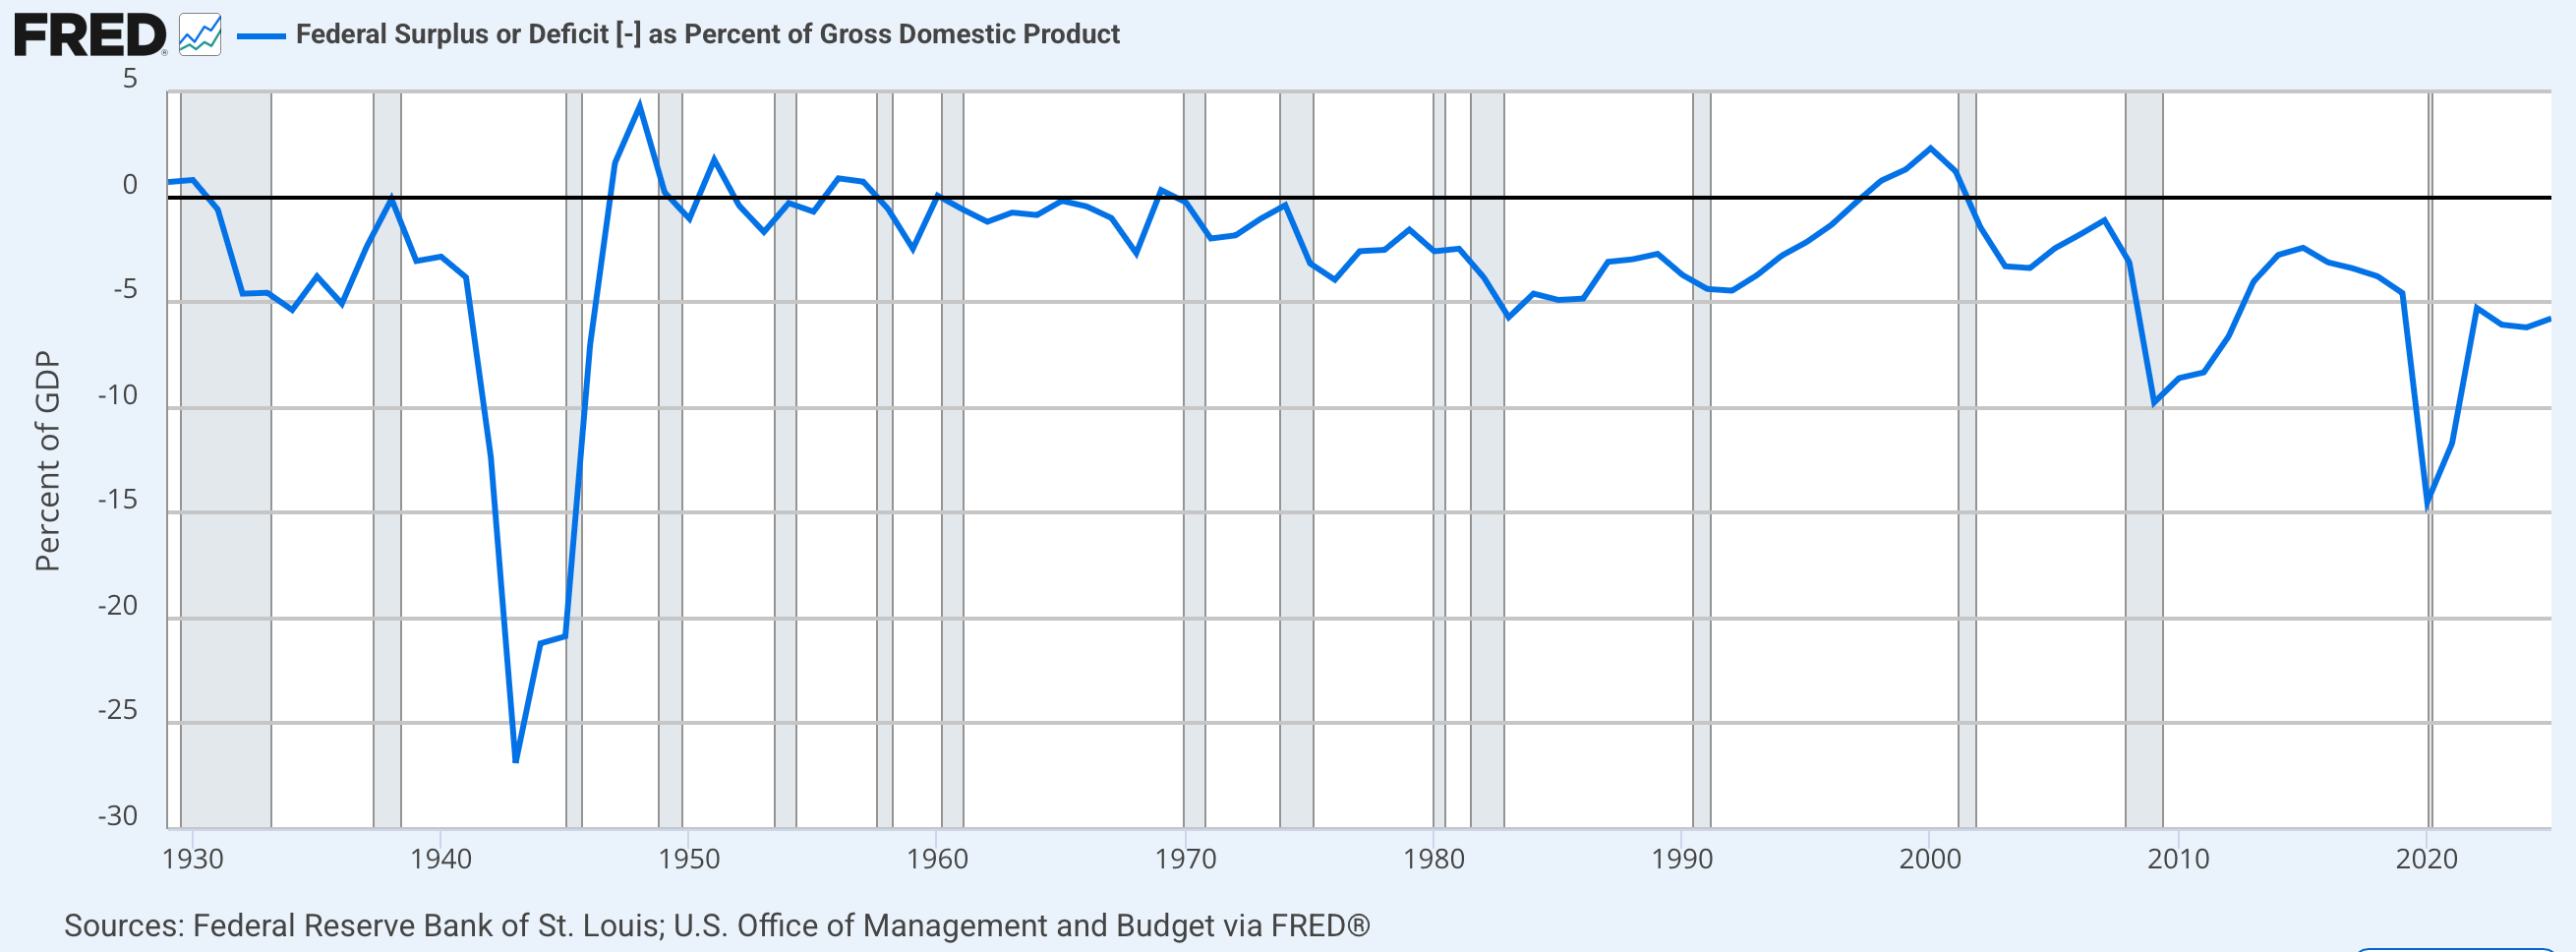
How big will that deficit become once the next recession strikes, and tax revenues shrink? 8%? 9%? More?
What happens then to the dollar and US treasury yields? Will the Federal Reserve resort to another bout of inflationary QE money printing to plug the government’s even higher borrowing needs, leading to a loss of confidence in the dollar? Even with the Fed scooping up vast slugs of US treasury bills and bonds, will investors go on a buyers’ strike, sending bond yields much higher?
Good luck to all if long-dated yields get to 6, 7, or 8%. Not least since those yields provide the reference price for fixed-rate residential mortgages, corporate bonds, and all sorts of other lending.
Investment: This refers to capital expenditure. And guess what, a very large part of that current capital expenditure is coming from the AI infrastructure frenzy.
I’ve seen estimates that around 75% of total GDP growth of 2% could be attributed to the AI infrastructure boom. In which case, what happens if that boom comes to a hard stop, or even just a rapid slowdown? Not good for the GDP outlook, sooner or later.
Net Exports: Net exports are the amount of exports (money in) less the amount of imports (money out). The US famously runs huge trade deficits, where imports are much large than exports.
President Trump’s import tariffs are obviously designed to reduce imports, by raising prices, and to encourage domestic production. Reduced imports boost the GDP number. But do they really mean that most people are better off? Sure, a few domestic manufacturing jobs could be created. But the vast majority of people are simply lumbered with higher prices in the shops.
Bigger picture, there hasn’t been a normal recession in the United States for 17 years. That’s if we exclude the self-inflicted economic shutdown during the Covid pandemic, and subsequent strong bounce.
This time gap is an extreme outlier. According to a recent piece of research by James Ferguson at MacroStrategy Partnership (hat tip to James), on average a US recession came around every six years between World War II and 2009 (GFC).
Recessions are periods when the tide goes out and we find out who is swimming naked. Prior misallocations of capital - malinvestments - are written down, weak companies go under, debts are called in, banks write off loads of loans, unemployment rises.
In short, there’s an awful lot of pain compacted into a short period of time. On average, five years of expansion followed by roughly a year of contraction. This is a necessary feature of a capitalist economy. The decks are cleared during the downturns, and prepared for the next wave of growth.
But what happens if there hasn’t been a recession for 17 years, when it finally strikes? And especially when much of the investment and consumption during that drawn-out period was financed with ultra-cheap debt.
I suspect the answer is a mega-recession, sooner or later. There’s almost certainly a vast amount of pent-up malinvestment to be sorted through. Surprisingly enough, no recession is good for aggregate corporate profits, and the result is a collapse of stock prices as investor confidence withers.
But it’s okay, because the US stock market certainly isn’t eye-wateringly expensive at the present time. No sirree. Nothing to see here. (Sarcasm alert, just in case.)
US Cyclically-Adjusted P/E (CAPE) ratio since 1871 (a.k.a. Shiller P/E)
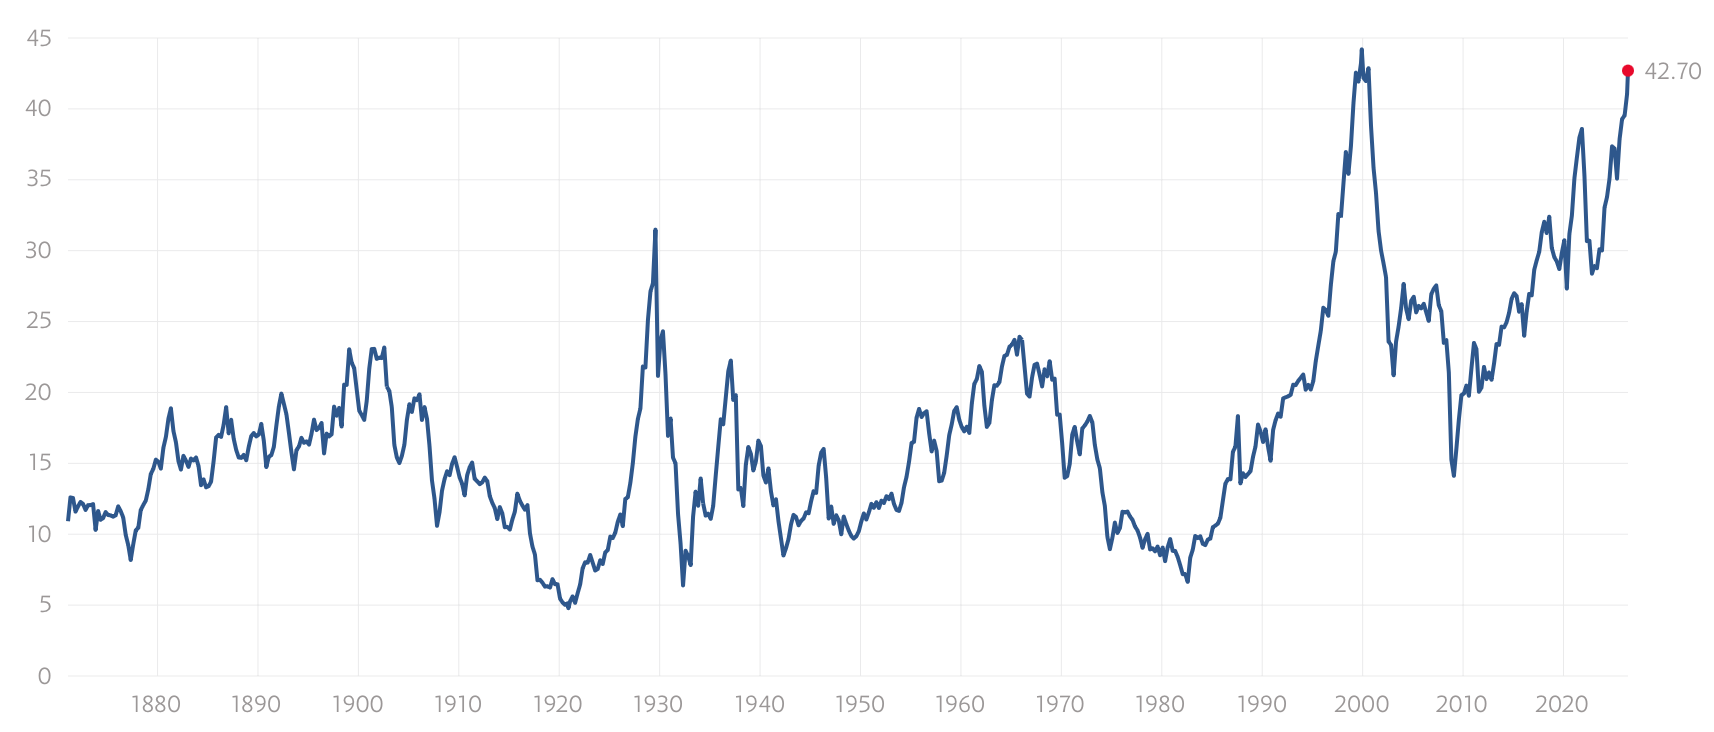
Source: multpl
As you can see, the US stock market’s CAPE ratio is closing in on the record high briefly reached in late 1999, at the height of the (last) tech bubble. In fact, it’s only 3.3% below that extreme level. Other measures are at extreme highs as well, such as the price-to-sales ratio.
This time it’s different?
Nah. My bet is that a new generation of investors is about to learn some very hard lessons. And given the very long time since the last clear out, it could really be something spectacular to behold.
What else can we add to this inauspicious backdrop? How about...
US midterm elections coming up in November, which have the potential to strip the Republicans of their majorities in one or both of the Houses of Congress.
Persistent inflation and rising bond yields.
The ongoing standoff between the US and Iran, and blockage of the Strait of Hormuz. We were told the war was going to last days, then a few weeks. We’re now past three months, and there’s no resolution. It could go either way.
The resultant global shortages of oil, oil products, aviation fuel, natural gas, fertilisers, and helium, which are about to bite badly as stocks run dry in many parts of the world.
The prospect of private credit loans going bad, lurking in the background, with unknown knock-on effects.
Two more ongoing wars: Russia / Ukraine and Israel / Lebanon.
Broader geopolitical risks that could flare up: e.g. China / Taiwan, the “Donroe doctrine” to dominate the Americas (Greenland, Canada, Mexico, Venezuela, Cuba).
One final thing. I recently had a feeling in my bones that all is not well in the market. This was because it seemed to me that individual stocks in my portfolio (or my watchlist) have been far more volatile than is the norm, with outsized daily moves (although largely cancelling out due to deliberate diversification). But the whole market indices didn’t look especially volatile. But I’ve now found some new evidence that backs up my intuition.
Rising stock volatility is often a sign that markets are about to break down. It’s a sign that investors are less confident, more tetchy, more likely to hit the trigger on trades. But it can lie hidden beneath the surface at the whole-market level.
The most-frequently quoted measure of index volatility for the S&P 500 index is the VIX. But actually it doesn’t measure index volatility directly. Instead it’s the implied volatility embedded within the prices of index option contracts. It’s arrived at by backing out other figures within the pricing formula, which are observable (such as the index price level, and the time to expiry of the options).
In other words, it’s what large traders in the options market expect index volatility to be over a relatively short period. As you can see from this chart that goes back to 1990, the VIX isn’t particularly elevated at the moment.
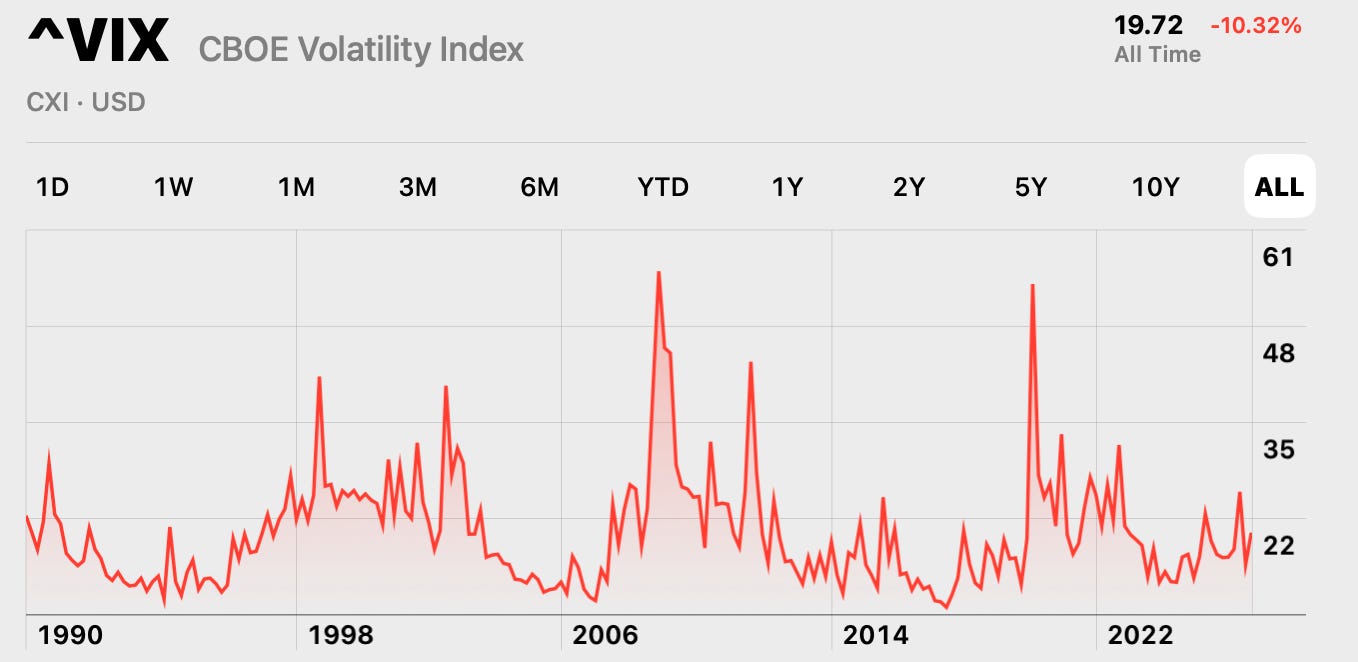
Source: Stocks (an app)
That said, the VIX did rise a whopping 39.7% just today, Friday, which gives a bit of a sense of foreboding that something’s about to break. The Nasdaq Composite index fell 4.8% today.
But there’s another volatility index that was already flashing warning signals. This is the CBOE S&P 500 Constituent Volatility Index (ticker:VIXEQ), which combines the actual price volatilities of each of the individual stocks within the index.
It only runs back to 2014, but it’s currently at a very elevated level. It’s only been markedly higher during the market chaos that struck when the Covid pandemic went global in early 2020, and marginally higher as stock markets plunged during 2022, shaken out of their complacency by rising interest rates, as inflation took off.
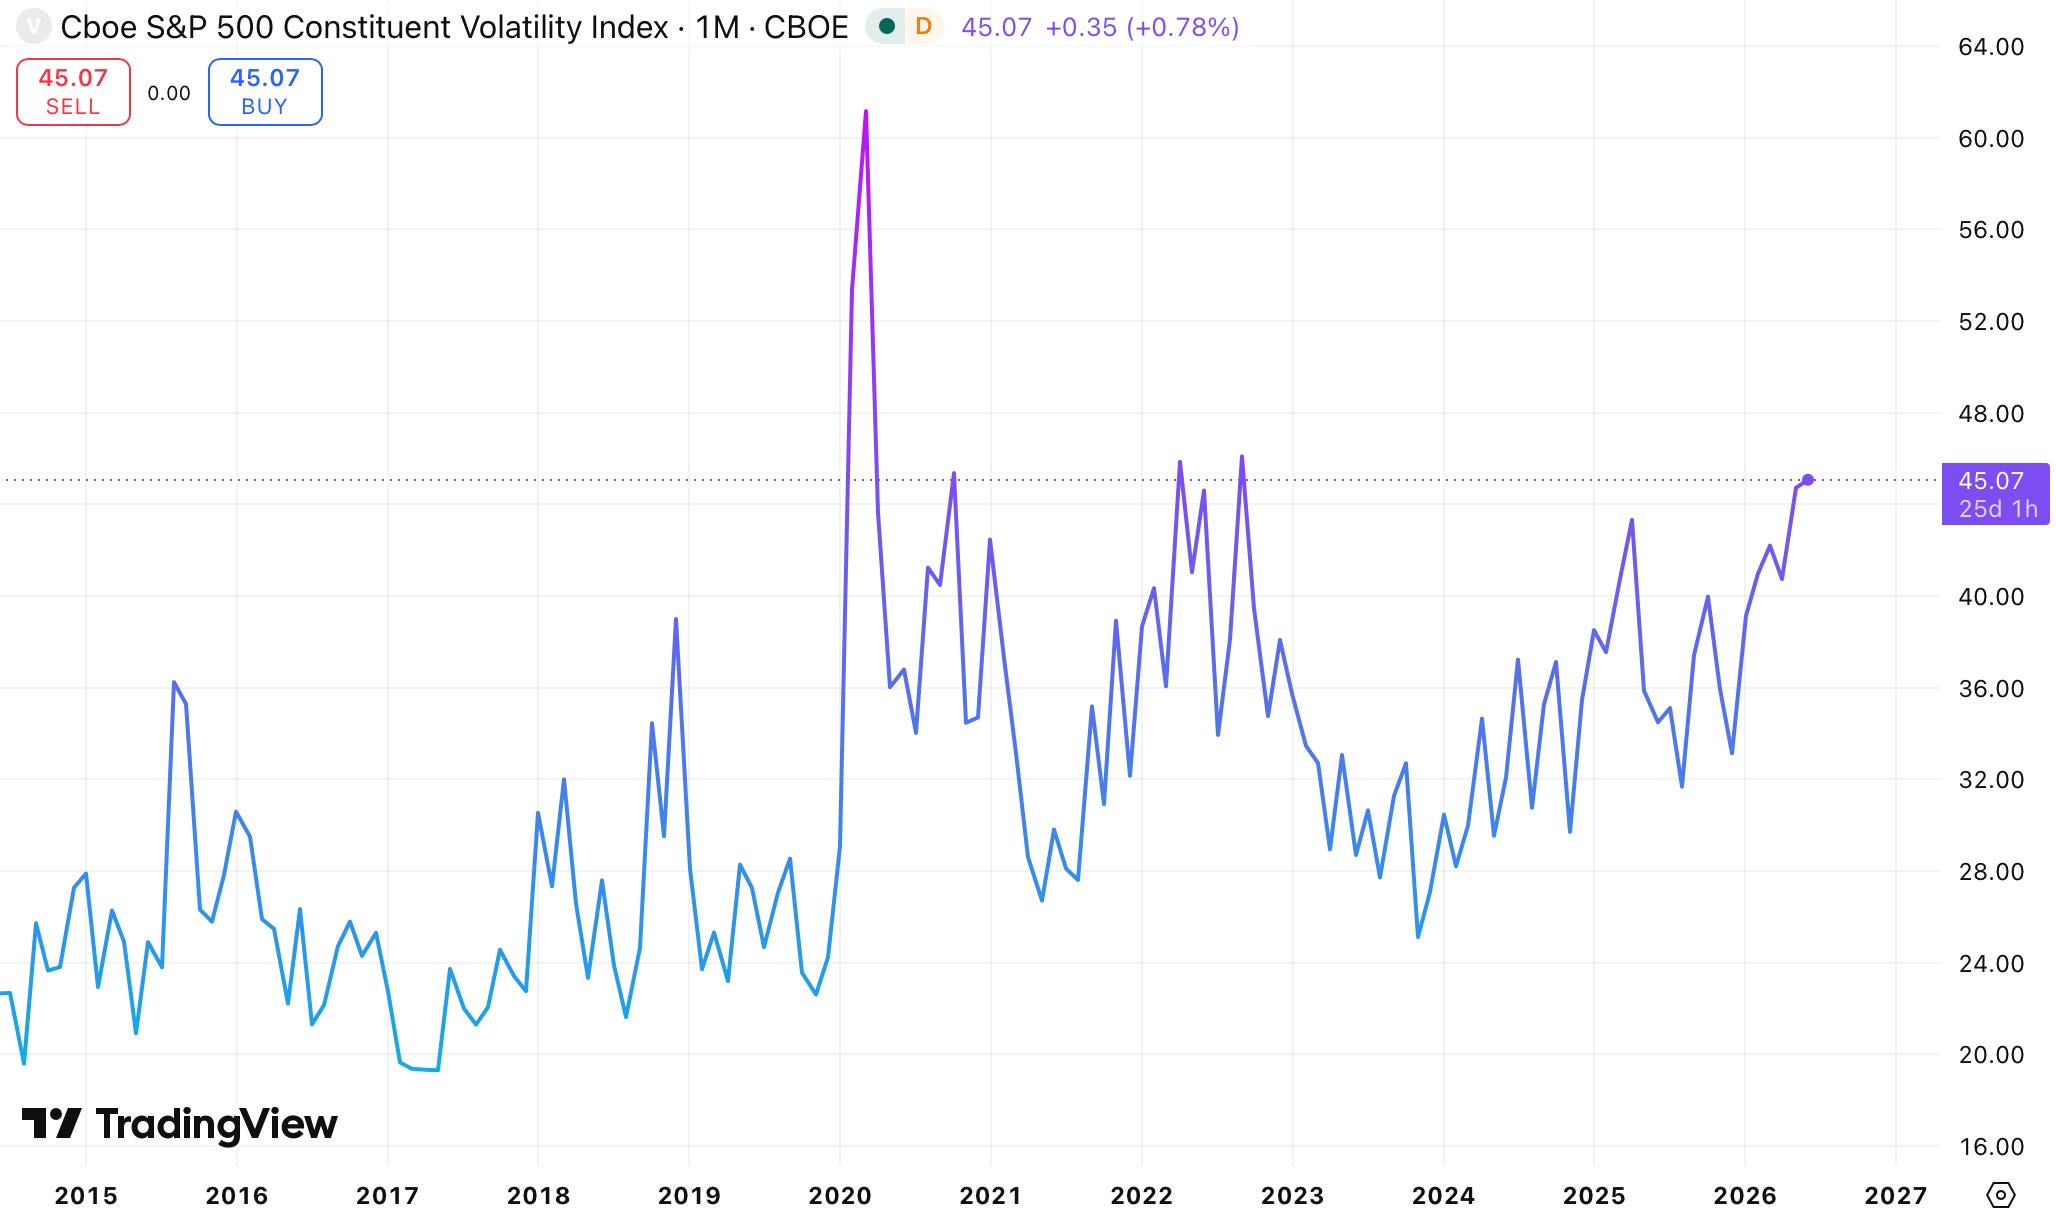
This appears to confirm my gut feeling about an increase in underlying volatility, at the individual stock level. Which is another warning.